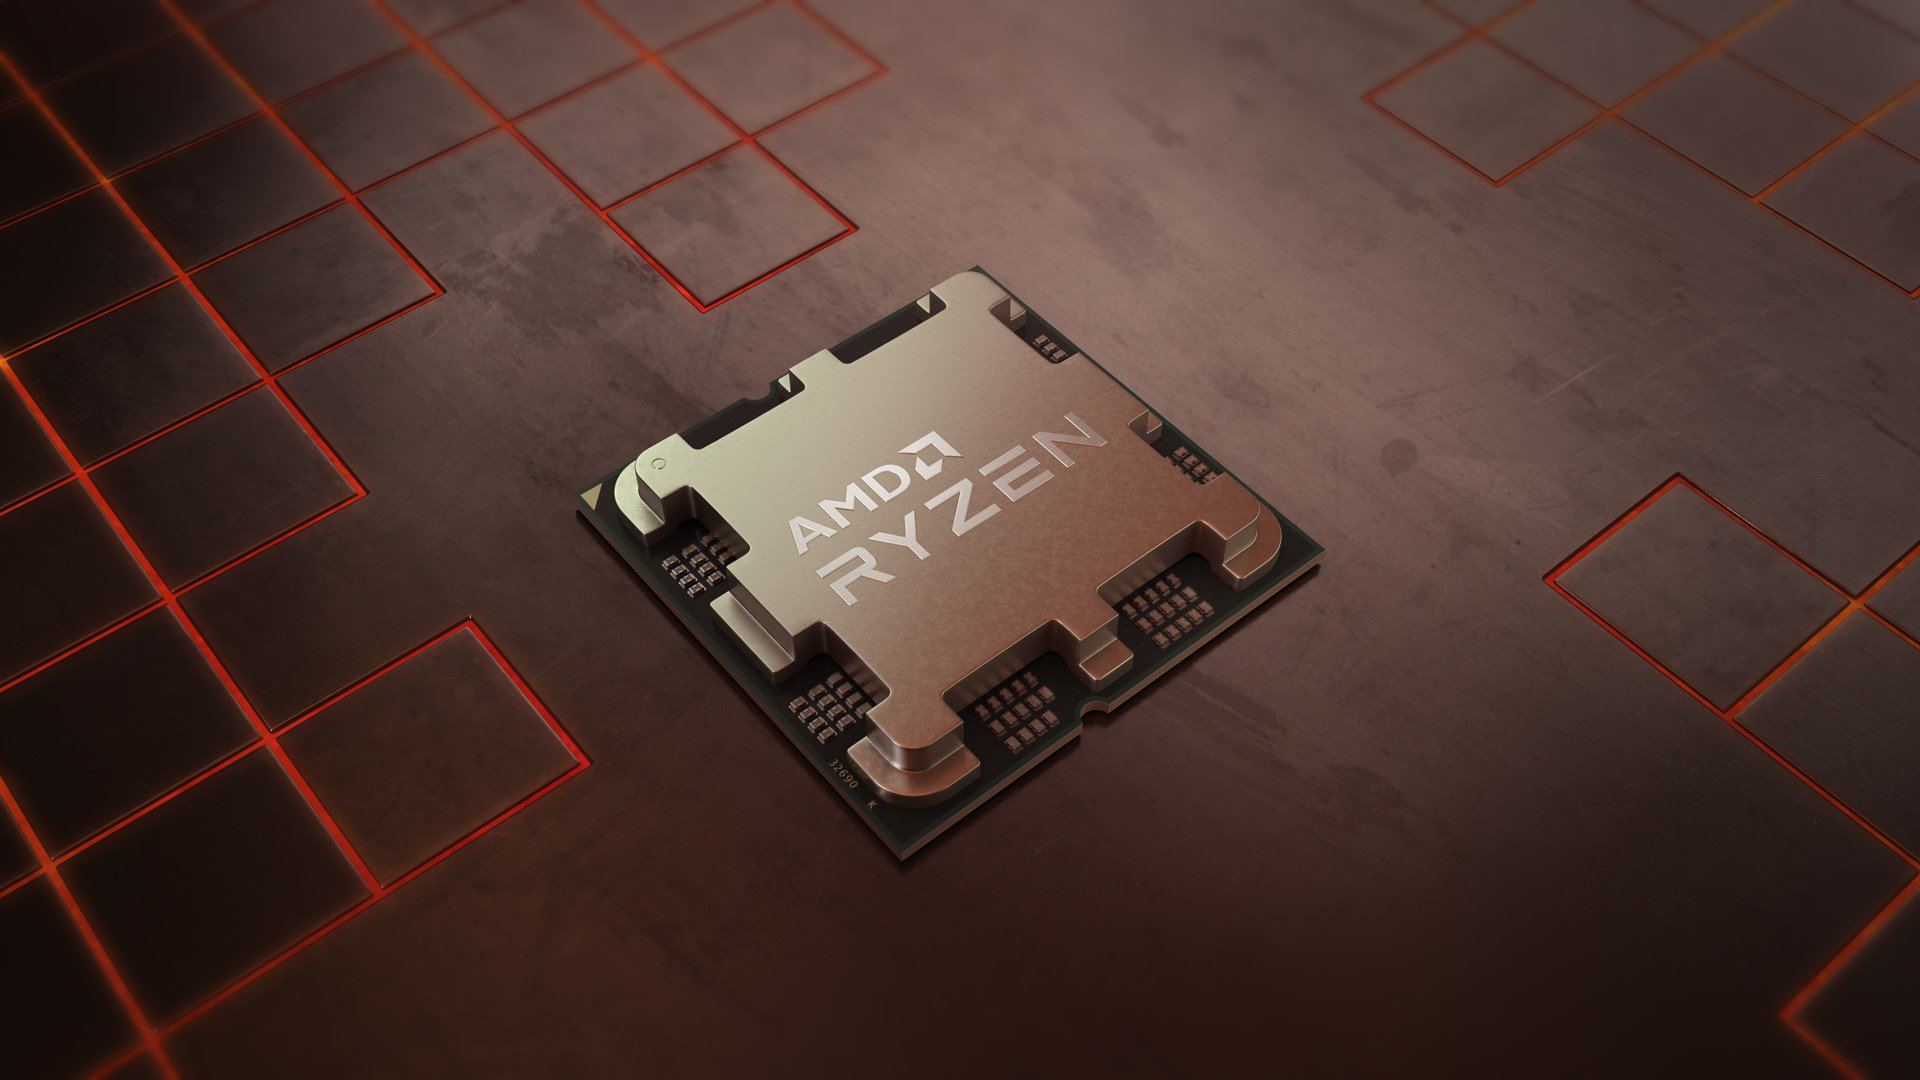
AMD Ryzen 5 2600X Benchmark, Test and specs
Last updated:
The AMD Ryzen 5 2600X was released in Q2/2018 and has 6 cores. The processor can process 12 threads simultaneously and uses a mainboard with the socket AM4 (PGA 1331). In the Geekbench 5 benchmark, the AMD Ryzen 5 2600X achieved a result of 1,052 points (single-core) or 5,782 points (multi-core).

| Name: | AMD Ryzen 5 2600X |
|---|---|
| Family: | AMD Ryzen 5 (84) |
| CPU group: | AMD Ryzen 2000 (9) |
| Architecture: | Pinnacle Ridge (Zen+) |
| Segment: | Desktop / Server |
| Generation: | 2 |
| Predecessor: | -- |
| Successor: | AMD Ryzen 5 3600X |
CPU Cores and Base Frequency
The AMD Ryzen 5 2600X has 6 cores. The clock frequency of the AMD Ryzen 5 2600X is 3.60 GHz (4.20 GHz). An initial performance assessment can be made using the number of CPU cores.
| CPU Cores / Threads: | 6 / 12 |
|---|---|
| Core architecture: | normal |
| Cores: | 6x |
| Hyperthreading / SMT: | Yes |
|---|---|
| Overclocking: | Yes |
| Frequency: | 3.60 GHz |
| Turbo Frequency (1 Core): | 4.20 GHz |
| Turbo Frequency (6 Cores): | 4.00 GHz |
Memory & PCIeThe AMD Ryzen 5 2600X supports a maximum of 64 GB memory. Depending on the mainboard, the processor can use a maximum of 2 (Dual Channel) memory channels. This results in a maximum bandwidth of the main memory of 46.9 GB/s. |
|
| Memory type: | Memory bandwidth: |
|---|---|
| DDR4-2933 | 46.9 GB/s |
| Max. Memory: | 64 GB |
| Memory channels: | 2 (Dual Channel) |
| ECC: | Yes |
| PCIe: | 3.0 x 20 |
| PCIe Bandwidth: | 19.7 GB/s |
Thermal ManagementThe AMD Ryzen 5 2600X has a TDP of 95 W. Based on the TDP, the system manufacturer can and must adapt the cooling solution to the processor. |
|
|---|---|
| TDP (PL1 / PBP): | 95 W |
| TDP (PL2): | -- |
| TDP up: | -- |
| TDP down: | -- |
| Tjunction max.: | 95 °C |
Technical details
Modern production reduces the waste heat of a processor and increases its efficiency. The AMD Ryzen 5 2600X is made in 12 nm and has 16.00 MB cache.
| Technology: | 12 nm |
|---|---|
| Chip design: | Chiplet |
| Socket: | AM4 (PGA 1331) |
| L2-Cache: | -- |
| L3-Cache: | 16.00 MB |
| AES-NI: | Yes |
| Operating systems: | Windows 10, Windows 11, Linux |
| Virtualization: | AMD-V, SVM |
|---|---|
| Instruction set (ISA): | x86-64 (64 bit) |
| ISA extensions: | SSE4a, SSE4.1, SSE4.2, AVX2, FMA3 |
| Release date: | Q2/2018 |
| Release price: | 220 $ |
| Part Number: | -- |
| Documents: | Technical data sheet |
Rate this processor
Benchmark results

The benchmark results for the AMD Ryzen 5 2600X have been carefully checked by us. We only publish benchmark results that have been created by us or that have been submitted by a visitor and then checked by a team member. All results are based on and fullfill our benchmark guidelines.
Screenshots:
Screenshots:
Cinebench 2024 (Single-Core)
The Cinebench 2024 benchmark is based on the Redshift rendering engine, which is also used in Maxon's 3D program Cinema 4D. The benchmark runs are each 10 minutes long to test whether the processor is limited by its heat generation.

|
AMD Ryzen 5 4600HS
6C 12T @ 4.00 GHz |
||

|
Intel Core i7-8809G
4C 8T @ 4.20 GHz |
||

|
Intel Xeon W-3175X
28C 56T @ 3.80 GHz |
||
|
|
AMD Ryzen 5 2600X
6C 12T @ 4.20 GHz |
||

|
Intel Core i3-10105F
4C 8T @ 4.40 GHz |
||

|
Intel Core i3-10105
4C 8T @ 4.40 GHz |
||

|
AMD Ryzen 5 5500U
6C 12T @ 4.00 GHz |
||
Cinebench 2024 (Multi-Core)
The Multi-Core test of the Cinebench 2024 benchmark uses all cpu cores to render using the Redshift rendering engine, which is also used in Maxons Cinema 4D. The benchmark run is 10 minutes long to test whether the processor is limited by its heat generation.

|
Intel Core i3-13100
4C 8T @ 4.50 GHz |
||

|
AMD Ryzen 5 7530U
6C 12T @ 4.50 GHz |
||

|
Intel Core i5-12500T
6C 12T @ 4.40 GHz |
||
|
|
AMD Ryzen 5 2600X
6C 12T @ 4.20 GHz |
||

|
AMD Ryzen 5 1600 AF
6C 12T @ 3.60 GHz |
||

|
Intel Core i5-10400F
6C 12T @ 4.30 GHz |
||

|
Intel Core i5-10400
6C 12T @ 4.30 GHz |
||
Cinebench R23 (Single-Core)
Cinebench R23 is the successor of Cinebench R20 and is also based on the Cinema 4 Suite. Cinema 4 is a worldwide used software to create 3D forms. The single-core test only uses one CPU core, the amount of cores or hyperthreading ability doesn't count.

|
Intel Core i5-8259U
4C 8T @ 3.80 GHz |
||

|
Intel Core i5-1034G1
4C 8T @ 3.60 GHz |
||

|
Intel Core i5-1035G1
4C 8T @ 3.60 GHz |
||
|
|
AMD Ryzen 5 2600X
6C 12T @ 4.20 GHz |
||

|
Intel Core i7-8850H
6C 12T @ 4.30 GHz |
||

|
Intel Core i3-9100F
4C 4T @ 4.20 GHz |
||

|
Intel Core i3-9100
4C 4T @ 4.20 GHz |
||
Cinebench R23 (Multi-Core)
Cinebench R23 is the successor of Cinebench R20 and is also based on the Cinema 4 Suite. Cinema 4 is a worldwide used software to create 3D forms. The multi-core test involves all CPU cores and taks a big advantage of hyperthreading.

|
Apple M1
8C 8T @ 3.20 GHz |
||

|
AMD Ryzen 5 2600
6C 12T @ 3.70 GHz |
||

|
Intel Core i7-1255U
10C 12T @ 2.70 GHz |
||
|
|
AMD Ryzen 5 2600X
6C 12T @ 4.00 GHz |
||

|
Intel Core i7-10850H
6C 12T @ 3.40 GHz |
||

|
Intel Core i5-9600KF
6C 6T @ 4.30 GHz |
||

|
Intel Core i5-9600K
6C 6T @ 4.30 GHz |
||
Geekbench 5, 64bit (Single-Core)
Geekbench 5 is a cross plattform benchmark that heavily uses the systems memory. A fast memory will push the result a lot. The single-core test only uses one CPU core, the amount of cores or hyperthreading ability doesn't count.

|
AMD EPYC 7402
24C 48T @ 3.35 GHz |
||

|
Intel Core i7-10510Y
4C 8T @ 4.50 GHz |
||

|
Intel Core i5-8400
6C 6T @ 4.00 GHz |
||
|
|
AMD Ryzen 5 2600X
6C 12T @ 4.20 GHz |
||

|
Intel Xeon W-2133
6C 12T @ 3.90 GHz |
||

|
AMD EPYC 7552
48C 96T @ 3.30 GHz |
||

|
AMD EPYC 7742
64C 128T @ 3.40 GHz |
||
Geekbench 5, 64bit (Multi-Core)
Geekbench 5 is a cross plattform benchmark that heavily uses the systems memory. A fast memory will push the result a lot. The multi-core test involves all CPU cores and taks a big advantage of hyperthreading.

|
Qualcomm Snapdragon 8cx Gen 3
8C 8T @ 3.00 GHz |
||
|
Intel Core i7-5930K
6C 12T @ 3.60 GHz |
||

|
AMD Ryzen 5 PRO 5650U
6C 12T @ 3.60 GHz |
||
|
|
AMD Ryzen 5 2600X
6C 12T @ 4.00 GHz |
||

|
Intel Xeon E-2334
4C 8T @ 3.40 GHz |
||

|
AMD Ryzen 7 2700E
8C 16T @ 3.20 GHz |
||

|
Intel Core i7-4930K
6C 12T @ 3.60 GHz |
||
Geekbench 6 (Single-Core)
Geekbench 6 is a benchmark for modern computers, notebooks and smartphones. What is new is an optimized utilization of newer CPU architectures, e.g. based on the big.LITTLE concept and combining CPU cores of different sizes. The single-core benchmark only evaluates the performance of the fastest CPU core, the number of CPU cores in a processor is irrelevant here.

|
Intel Core i5-8260U
4C 8T @ 3.90 GHz |
||

|
Intel Core i5-9300H
4C 8T @ 4.10 GHz |
||

|
Intel Core i5-9300HF
4C 8T @ 4.10 GHz |
||
|
|
AMD Ryzen 5 2600X
6C 12T @ 4.20 GHz |
||

|
Apple A12 Bionic
6C 6T @ 2.49 GHz |
||

|
Intel Core i5-8265U
4C 8T @ 3.90 GHz |
||

|
Intel Core i3-10100TE
4C 8T @ 3.60 GHz |
||
Geekbench 6 (Multi-Core)
Geekbench 6 is a benchmark for modern computers, notebooks and smartphones. What is new is an optimized utilization of newer CPU architectures, e.g. based on the big.LITTLE concept and combining CPU cores of different sizes. The multi-core benchmark evaluates the performance of all of the processor's CPU cores. Virtual thread improvements such as AMD SMT or Intel's Hyper-Threading have a positive impact on the benchmark result.

|
Intel Xeon D-2143IT
8C 16T @ 2.20 GHz |
||

|
Intel Core i7-11375H
4C 8T @ 4.60 GHz |
||

|
Intel Core i5-9600
6C 6T @ 4.10 GHz |
||
|
|
AMD Ryzen 5 2600X
6C 12T @ 4.00 GHz |
||

|
Intel Core i7-8700T
6C 12T @ 3.20 GHz |
||

|
Intel Core i9-8950HK
6C 12T @ 3.80 GHz |
||
|
AMD Ryzen 7 PRO 1700X
8C 16T @ 3.60 GHz |
||
Cinebench R20 (Single-Core)
Cinebench R20 is the successor of Cinebench R15 and is also based on the Cinema 4 Suite. Cinema 4 is a worldwide used software to create 3D forms. The single-core test only uses one CPU core, the amount of cores or hyperthreading ability doesn't count.

|
Intel Core i5-9300H
4C 8T @ 4.10 GHz |
||

|
Intel Core i5-9300HF
4C 8T @ 4.10 GHz |
||

|
Intel Core i9-9820X
10C 20T @ 4.20 GHz |
||
|
|
AMD Ryzen 5 2600X
6C 12T @ 4.20 GHz |
||

|
Intel Core i7-6700K
4C 8T @ 4.20 GHz |
||

|
Intel Core i5-1035G1
4C 8T @ 3.60 GHz |
||

|
Intel Core i7-8750H
6C 12T @ 4.10 GHz |
||
Cinebench R20 (Multi-Core)
Cinebench R20 is the successor of Cinebench R15 and is also based on the Cinema 4 Suite. Cinema 4 is a worldwide used software to create 3D forms. The multi-core test involves all CPU cores and taks a big advantage of hyperthreading.

|
Intel Xeon E5-2680 v4
14C 28T @ 2.70 GHz |
||

|
AMD Ryzen 7 2700E
8C 16T @ 3.20 GHz |
||

|
Intel Core i7-5930K
6C 12T @ 3.60 GHz |
||
|
|
AMD Ryzen 5 2600X
6C 12T @ 4.00 GHz |
||

|
Intel Core i7-1255U
10C 12T @ 2.70 GHz |
||

|
AMD Ryzen 7 PRO 4750U
8C 16T @ 3.10 GHz |
||

|
Intel Core i5-10600T
6C 12T @ 3.70 GHz |
||
Blender 3.1 Benchmark
In the Blender Benchmark 3.1, the scenes "monster", "junkshop" and "classroom" are rendered and the time required by the system is measured. In our benchmark we test the CPU and not the graphics card. Blender 3.1 was presented as a standalone version in March 2022.

|
Intel Core i9-11950H
8C 16T @ 3.70 GHz |
||

|
Intel Core i5-10400
6C 12T @ 4.00 GHz |
||

|
Intel Core i5-10400F
6C 12T @ 4.00 GHz |
||
|
|
AMD Ryzen 5 2600X
6C 12T @ 4.00 GHz |
||

|
AMD Ryzen 5 4600H
6C 12T @ 4.00 GHz |
||

|
AMD Ryzen 5 1600
6C 12T @ 3.40 GHz |
||

|
AMD Ryzen 5 PRO 1600
6C 12T @ 3.40 GHz |
||
Estimated results for PassMark CPU Mark
Some of the CPUs listed below have been benchmarked by CPU-monkey. However the majority of CPUs have not been tested and the results have been estimated by a CPU-monkey’s secret proprietary formula. As such they do not accurately reflect the actual Passmark CPU mark values and are not endorsed by PassMark Software Pty Ltd.

|
Intel Xeon E-2236
6C 6T @ 3.90 GHz |
||

|
Intel Xeon E-2246G
6C 12T @ 4.10 GHz |
||

|
Intel Xeon E5-2650 v4
12C 24T @ 2.50 GHz |
||
|
|
AMD Ryzen 5 2600X
6C 12T @ 4.00 GHz |
||

|
AMD EPYC Embedded 3251
8C 16T @ 2.50 GHz |
||

|
Intel Core i9-9880H
8C 16T @ 3.40 GHz |
||

|
Intel Xeon E5-2667 v4
8C 16T @ 3.40 GHz |
||
Blender 2.81 (bmw27)
Blender is a free 3D graphics software for rendering (creating) 3D bodies, which can also be textured and animated in the software. The Blender benchmark creates predefined scenes and measures the time (s) required for the entire scene. The shorter the time required, the better. We selected bmw27 as the benchmark scene.

|
Intel Core i7-5960X
8C 16T @ 3.20 GHz |
||

|
Apple M2
8C 8T @ 3.50 GHz |
||

|
Apple M2 (8-GPU)
8C 8T @ 3.50 GHz |
||
|
|
AMD Ryzen 5 2600X
6C 12T @ 4.00 GHz |
||

|
Intel Core i7-6850K
6C 12T @ 3.60 GHz |
||

|
Intel Core i7-9700KF
8C 8T @ 4.60 GHz |
||

|
Intel Xeon E5-2643 v4
6C 12T @ 3.60 GHz |
||
CPU-Z Benchmark 17 (Single-Core)
The CPU-Z benchmark measures a processor's performance by measuring the time it takes the system to complete all benchmark calculations. The faster the benchmark is completed, the higher the score.

|
Intel Core i7-4790K
4C 8T @ 4.20 GHz |
||

|
Intel Core i7-9750H
6C 12T @ 3.20 GHz |
||

|
Intel Core i5-8400
6C 6T @ 3.80 GHz |
||
|
|
AMD Ryzen 5 2600X
6C 12T @ 4.00 GHz |
||

|
Intel Core i7-7700
4C 8T @ 4.00 GHz |
||

|
AMD Ryzen 5 3400G
4C 8T @ 4.00 GHz |
||

|
Intel Core i7-8750H
6C 12T @ 3.90 GHz |
||
CPU-Z Benchmark 17 (Multi-Core)
The CPU-Z benchmark measures a processor's performance by measuring the time it takes the system to complete all benchmark calculations. The faster the benchmark is completed, the higher the score.

|
Intel Core i3-14100
4C 8T @ 3.50 GHz |
||

|
Intel Xeon E5-2670 v2
10C 20T @ 2.50 GHz |
||

|
Intel Xeon E5-2667 v2
8C 16T @ 3.30 GHz |
||
|
|
AMD Ryzen 5 2600X
6C 12T @ 3.60 GHz |
||

|
Intel Core i5-10400
6C 12T @ 2.90 GHz |
||

|
Intel Core i5-10400F
6C 12T @ 2.90 GHz |
||

|
Intel Core i7-6850K
6C 12T @ 3.60 GHz |
||
Cinebench R15 (Single-Core)
Cinebench R15 is the successor of Cinebench 11.5 and is also based on the Cinema 4 Suite. Cinema 4 is a worldwide used software to create 3D forms. The single-core test only uses one CPU core, the amount of cores or hyperthreading ability doesn't count.

|
AMD Ryzen 7 2700X
8C 16T @ 4.30 GHz |
||

|
Intel Core i7-5960X
8C 16T @ 3.50 GHz |
||

|
Intel Xeon E5-1660 v3
8C 16T @ 3.50 GHz |
||
|
|
AMD Ryzen 5 2600X
6C 12T @ 4.20 GHz |
||

|
Intel Pentium Gold G6600
2C 4T @ 4.20 GHz |
||

|
Intel Core i3-10300T
4C 8T @ 3.90 GHz |
||

|
Intel Xeon E3-1535M v6
4C 8T @ 4.20 GHz |
||
Cinebench R15 (Multi-Core)
Cinebench R15 is the successor of Cinebench 11.5 and is also based on the Cinema 4 Suite. Cinema 4 is a worldwide used software to create 3D forms. The multi-core test involves all CPU cores and taks a big advantage of hyperthreading.

|
AMD Ryzen 9 4900U
8C 16T @ 3.40 GHz |
||

|
Intel Xeon W-2135
6C 12T @ 4.20 GHz |
||

|
Intel Xeon E5-2650 v3
10C 20T @ 2.60 GHz |
||
|
|
AMD Ryzen 5 2600X
6C 12T @ 4.00 GHz |
||

|
Intel Xeon E5-2630 v4
10C 20T @ 2.60 GHz |
||

|
AMD Ryzen 7 2700E
8C 16T @ 3.20 GHz |
||

|
Intel Xeon E5-1660 v3
8C 16T @ 3.20 GHz |
||
Benchmarks

Cinebench 2024 (SC)
272 entries
272 entries

Cinebench 2024 (MC)
271 entries
271 entries

Cinebench R23 (SC)
586 entries
586 entries

Cinebench R23 (MC)
565 entries
565 entries

Geekbench 5 (SC)
2,488 entries
2,488 entries

Geekbench 5 (MC)
2,461 entries
2,461 entries

Geekbench 6 (SC)
1,755 entries
1,755 entries

Geekbench 6 (MC)
1,703 entries
1,703 entries

Cinebench R20 (SC)
656 entries
656 entries

Cinebench R20 (MC)
604 entries
604 entries

Blender 3.1 Benchmark
212 entries
212 entries

PassMark CPU-Mark
2,392 entries
2,392 entries

Blender 2.81 (bmw27)
190 entries
190 entries

CPU-Z Benchmark 17 (SC)
231 entries
231 entries

CPU-Z Benchmark 17 (MC)
733 entries
733 entries

Monero Hashrate
94 entries
94 entries

V-Ray CPU-Render
249 entries
249 entries

Cinebench R15 (SC)
1,106 entries
1,106 entries

Cinebench R15 (MC)
1,101 entries
1,101 entries

Geekbench 3 (SC)
942 entries
942 entries

Geekbench 3 (MC)
938 entries
938 entries

Cinebench R11.5 (SC)
825 entries
825 entries

Cinebench R11.5 (MC)
836 entries
836 entries
News and articles for the AMD Ryzen 5 2600X
Description of the processor
The AMD Ryzen 5 2600x is a 6-core processor of the manufacturer AMD. It is based on the Zen + Architecture of Zen Design (Pinnacle Ridge) and is manufactured in 12 nm in globalfoundries. He supports hyper-threading and can provide 12 logical processors. Multithreading applications benefit as well as virtualization and modern AAA games.Through its high clock frequencies, the AMD Ryzen 5 2600x is also very good as a game processor. There are already 3.6 GHz already in the base cycle. The frequencies can lift the processor with multi-core load to 4 GHz. Older applications or games that can only appeal to a processor core at the same time run up to 4.2 GHz.
It is released for the use of DDR4-2933 Memory. But faster memory modules can also be operated. For this purpose, the processor has two memory channels and supports dual-channel mode that significantly increases the memory bandwidth. The ECC error correction of the memory is supported, but requires a compatible mainboard with ECC support.
Due to its good price-performance ratio as well as its good stroke pleasure, the AMD Ryzen 5 2600x is a very popular processor on CPU-Monkey. It is often recommended to OC beginners, as the complexity of overclocking increases with the number of cores. AMD has provided the AMD Ryzen 5 2600x with a higher TDP of 95 watts, the standard for Ryzen 5 and Ryzen 7 processors is 65 watts. Due to the higher TDP higher clock frequencies are easier to achieve. In the overclocking, however, the 95 watts are significantly exceeded depending on the clock frequency of the processor.
The AMD Ryzen 5 2600X was presented in Q2 / 2018 at a price of $ 220. It has 16 MB Level 3 cache and supports modern virtualization functions as well as encryption via hardware.
Popular comparisons
back to index


