

AMD Ryzen 7 5800X vs Intel Core i9-9900K
Last updated:
CPU comparison with benchmarks
|
 |
|
| AMD Ryzen 7 5800X | Intel Core i9-9900K | |
CPU comparisonIn this CPU comparison, we compare the AMD Ryzen 7 5800X and the Intel Core i9-9900K and use benchmarks to check which processor is faster.
We compare the AMD Ryzen 7 5800X 8 core processor released in Q4/2020 with the Intel Core i9-9900K which has 8 CPU cores and was introduced in Q4/2018. |
||
| AMD Ryzen 7 (67) | Family | Intel Core i9 (78) |
| AMD Ryzen 5000 (12) | CPU group | Intel Core i 9000 (34) |
| 4 | Generation | 9 |
| Vermeer (Zen 3) | Architecture | Coffee Lake S Refresh |
| Desktop / Server | Segment | Desktop / Server |
| AMD Ryzen 7 3800X | Predecessor | -- |
| -- | Successor | Intel Core i9-10900K |
|
|
||
CPU Cores and Base FrequencyThe AMD Ryzen 7 5800X is a 8 core processor with a clock frequency of 3.80 GHz (4.70 GHz). The processor can compute 16 threads at the same time. The Intel Core i9-9900K clocks with 3.60 GHz (5.00 GHz), has 8 CPU cores and can calculate 16 threads in parallel. |
||
| AMD Ryzen 7 5800X | Characteristic | Intel Core i9-9900K |
| 8 | Cores | 8 |
| 16 | Threads | 16 |
| normal | Core architecture | normal |
| Yes | Hyperthreading | Yes |
| Yes | Overclocking ? | Yes |
| 3.80 GHz | Frequency | 3.60 GHz |
| 4.70 GHz | Turbo Frequency (1 Core) | 5.00 GHz |
| 4.40 GHz | Turbo Frequency (All Cores) | 4.70 GHz |
Internal GraphicsGraphics (iGPU) integrated into the processor not only enable image output without having to rely on a dedicated graphics solution, but can also efficiently accelerate video playback. |
||
| no iGPU | GPU | Intel UHD Graphics 630 |
| GPU frequency | 0.35 GHz | |
| -- | GPU (Turbo) | 1.20 GHz |
| -- | GPU Generation | 9.5 |
| Technology | 14 nm | |
| Max. displays | 3 | |
| -- | Compute units | 24 |
| -- | Shader | 192 |
| No | Hardware Raytracing | No |
| No | Frame Generation | No |
| -- | Max. GPU Memory | 64 GB |
| -- | DirectX Version | 12 |
Hardware codec supportA photo or video codec that is accelerated in hardware can greatly accelerate the working speed of a processor and extend the battery life of notebooks or smartphones when playing videos. |
||
| no iGPU | GPU | Intel UHD Graphics 630 |
| No | Codec h265 / HEVC (8 bit) | Decode / Encode |
| No | Codec h265 / HEVC (10 bit) | Decode / Encode |
| No | Codec h264 | Decode / Encode |
| No | Codec VP9 | Decode / Encode |
| No | Codec VP8 | Decode / Encode |
| No | Codec AV1 | No |
| No | Codec AVC | Decode / Encode |
| No | Codec VC-1 | Decode |
| No | Codec JPEG | Decode / Encode |
Memory & PCIeUp to 128 GB of memory in a maximum of 2 memory channels is supported by the AMD Ryzen 7 5800X, while the Intel Core i9-9900K supports a maximum of 128 GB of memory with a maximum memory bandwidth of 42.7 GB/s enabled. |
||
| AMD Ryzen 7 5800X | Characteristic | Intel Core i9-9900K |
| DDR4-3200 | Memory | DDR4-2666 |
| 128 GB | Max. Memory | 128 GB |
| 2 (Dual Channel) | Memory channels | 2 (Dual Channel) |
| 51.2 GB/s | Max. Bandwidth | 42.7 GB/s |
| Yes | ECC | No |
| 4.00 MB | L2 Cache | -- |
| 32.00 MB | L3 Cache | 16.00 MB |
| 4.0 | PCIe version | 3.0 |
| 20 | PCIe lanes | 16 |
| 39.4 GB/s | PCIe Bandwidth | 15.8 GB/s |
Thermal ManagementThe AMD Ryzen 7 5800X has a TDP of 105 W. The TDP of the Intel Core i9-9900K is 95 W. System integrators use the TDP of the processor as a guide when dimensioning the cooling solution. |
||
| AMD Ryzen 7 5800X | Characteristic | Intel Core i9-9900K |
| 105 W | TDP (PL1 / PBP) | 95 W |
| -- | TDP (PL2) | 119 W @ 28 s |
| -- | TDP up | -- |
| -- | TDP down | -- |
| 90 °C | Tjunction max. | 100 °C |
Technical detailsThe AMD Ryzen 7 5800X has 36.00 MB cache and is manufactured in 7 nm. The cache of Intel Core i9-9900K is at 16.00 MB. The processor is manufactured in 14 nm. |
||
| AMD Ryzen 7 5800X | Characteristic | Intel Core i9-9900K |
| 7 nm | Technology | 14 nm |
| Chiplet | Chip design | Monolithic |
| x86-64 (64 bit) | Instruction set (ISA) | x86-64 (64 bit) |
| SSE4a, SSE4.1, SSE4.2, AVX2, FMA3 | ISA extensions | SSE4.1, SSE4.2, AVX2 |
| AM4 (PGA 1331) | Socket | LGA 1151-2 |
| AMD-V, SVM | Virtualization | VT-x, VT-x EPT, VT-d |
| Yes | AES-NI | Yes |
| Windows 10, Windows 11, Linux | Operating systems | Windows 10, Windows 11, Linux |
| Q4/2020 | Release date | Q4/2018 |
| 449 $ | Release price | 650 $ |
| show more data | show more data | |

8C 16T @ 3.80 GHz (4.70 GHz) buy now on Amazon and save!
8C 16T @ 3.60 GHz (5.00 GHz) buy now on Amazon and save!
|
||
Rate these processors
Average performance in benchmarks
⌀ Single core performance in 7 CPU benchmarks
⌀ Multi core performance in 9 CPU benchmarks
Cinebench 2024 (Single-Core)
The Cinebench 2024 benchmark is based on the Redshift rendering engine, which is also used in Maxon's 3D program Cinema 4D. The benchmark runs are each 10 minutes long to test whether the processor is limited by its heat generation.
|
|
AMD Ryzen 7 5800X
8C 16T @ 4.70 GHz |
||
|
|
Intel Core i9-9900K
8C 16T @ 5.00 GHz |
||
Cinebench 2024 (Multi-Core)
The Multi-Core test of the Cinebench 2024 benchmark uses all cpu cores to render using the Redshift rendering engine, which is also used in Maxons Cinema 4D. The benchmark run is 10 minutes long to test whether the processor is limited by its heat generation.
|
|
AMD Ryzen 7 5800X
8C 16T @ 4.70 GHz |
||
|
|
Intel Core i9-9900K
8C 16T @ 5.00 GHz |
||
Cinebench R23 (Single-Core)
Cinebench R23 is the successor of Cinebench R20 and is also based on the Cinema 4 Suite. Cinema 4 is a worldwide used software to create 3D forms. The single-core test only uses one CPU core, the amount of cores or hyperthreading ability doesn't count.
|
|
AMD Ryzen 7 5800X
8C 16T @ 4.70 GHz |
||
|
|
Intel Core i9-9900K
8C 16T @ 5.00 GHz |
||
Cinebench R23 (Multi-Core)
Cinebench R23 is the successor of Cinebench R20 and is also based on the Cinema 4 Suite. Cinema 4 is a worldwide used software to create 3D forms. The multi-core test involves all CPU cores and taks a big advantage of hyperthreading.
|
|
AMD Ryzen 7 5800X
8C 16T @ 4.40 GHz |
||
|
|
Intel Core i9-9900K
8C 16T @ 4.70 GHz |
||
Geekbench 5, 64bit (Single-Core)
Geekbench 5 is a cross plattform benchmark that heavily uses the systems memory. A fast memory will push the result a lot. The single-core test only uses one CPU core, the amount of cores or hyperthreading ability doesn't count.
|
|
AMD Ryzen 7 5800X
8C 16T @ 4.70 GHz |
||
|
|
Intel Core i9-9900K
8C 16T @ 5.00 GHz |
||
Geekbench 5, 64bit (Multi-Core)
Geekbench 5 is a cross plattform benchmark that heavily uses the systems memory. A fast memory will push the result a lot. The multi-core test involves all CPU cores and taks a big advantage of hyperthreading.
|
|
AMD Ryzen 7 5800X
8C 16T @ 4.40 GHz |
||
|
|
Intel Core i9-9900K
8C 16T @ 4.70 GHz |
||
Geekbench 6 (Single-Core)
Geekbench 6 is a benchmark for modern computers, notebooks and smartphones. What is new is an optimized utilization of newer CPU architectures, e.g. based on the big.LITTLE concept and combining CPU cores of different sizes. The single-core benchmark only evaluates the performance of the fastest CPU core, the number of CPU cores in a processor is irrelevant here.
|
|
AMD Ryzen 7 5800X
8C 16T @ 4.70 GHz |
||
|
|
Intel Core i9-9900K
8C 16T @ 5.00 GHz |
||
Geekbench 6 (Multi-Core)
Geekbench 6 is a benchmark for modern computers, notebooks and smartphones. What is new is an optimized utilization of newer CPU architectures, e.g. based on the big.LITTLE concept and combining CPU cores of different sizes. The multi-core benchmark evaluates the performance of all of the processor's CPU cores. Virtual thread improvements such as AMD SMT or Intel's Hyper-Threading have a positive impact on the benchmark result.
|
|
AMD Ryzen 7 5800X
8C 16T @ 4.40 GHz |
||
|
|
Intel Core i9-9900K
8C 16T @ 4.70 GHz |
||
Cinebench R20 (Single-Core)
Cinebench R20 is the successor of Cinebench R15 and is also based on the Cinema 4 Suite. Cinema 4 is a worldwide used software to create 3D forms. The single-core test only uses one CPU core, the amount of cores or hyperthreading ability doesn't count.
|
|
AMD Ryzen 7 5800X
8C 16T @ 4.70 GHz |
||
|
|
Intel Core i9-9900K
8C 16T @ 5.00 GHz |
||
Cinebench R20 (Multi-Core)
Cinebench R20 is the successor of Cinebench R15 and is also based on the Cinema 4 Suite. Cinema 4 is a worldwide used software to create 3D forms. The multi-core test involves all CPU cores and taks a big advantage of hyperthreading.
|
|
AMD Ryzen 7 5800X
8C 16T @ 4.40 GHz |
||
|
|
Intel Core i9-9900K
8C 16T @ 4.70 GHz |
||
Blender 3.1 Benchmark
In the Blender Benchmark 3.1, the scenes "monster", "junkshop" and "classroom" are rendered and the time required by the system is measured. In our benchmark we test the CPU and not the graphics card. Blender 3.1 was presented as a standalone version in March 2022.
|
|
AMD Ryzen 7 5800X
8C 16T @ 4.40 GHz |
||
|
|
Intel Core i9-9900K
8C 16T @ 4.70 GHz |
||
Estimated results for PassMark CPU Mark
Some of the CPUs listed below have been benchmarked by CPU-monkey. However the majority of CPUs have not been tested and the results have been estimated by a CPU-monkey’s secret proprietary formula. As such they do not accurately reflect the actual Passmark CPU mark values and are not endorsed by PassMark Software Pty Ltd.
|
|
AMD Ryzen 7 5800X
8C 16T @ 4.40 GHz |
||
|
|
Intel Core i9-9900K
8C 16T @ 4.70 GHz |
||
CPU-Z Benchmark 17 (Single-Core)
The CPU-Z benchmark measures a processor's performance by measuring the time it takes the system to complete all benchmark calculations. The faster the benchmark is completed, the higher the score.
|
|
AMD Ryzen 7 5800X
8C 16T @ 4.40 GHz |
||
|
|
Intel Core i9-9900K
8C 16T @ 4.70 GHz |
||
CPU-Z Benchmark 17 (Multi-Core)
The CPU-Z benchmark measures a processor's performance by measuring the time it takes the system to complete all benchmark calculations. The faster the benchmark is completed, the higher the score.
|
|
AMD Ryzen 7 5800X
8C 16T @ 3.80 GHz |
||
|
|
Intel Core i9-9900K
8C 16T @ 3.60 GHz |
||
Cinebench R15 (Single-Core)
Cinebench R15 is the successor of Cinebench 11.5 and is also based on the Cinema 4 Suite. Cinema 4 is a worldwide used software to create 3D forms. The single-core test only uses one CPU core, the amount of cores or hyperthreading ability doesn't count.
|
|
AMD Ryzen 7 5800X
8C 16T @ 4.70 GHz |
||
|
|
Intel Core i9-9900K
8C 16T @ 5.00 GHz |
||
Cinebench R15 (Multi-Core)
Cinebench R15 is the successor of Cinebench 11.5 and is also based on the Cinema 4 Suite. Cinema 4 is a worldwide used software to create 3D forms. The multi-core test involves all CPU cores and taks a big advantage of hyperthreading.
|
|
AMD Ryzen 7 5800X
8C 16T @ 4.40 GHz |
||
|
|
Intel Core i9-9900K
8C 16T @ 4.70 GHz |
||
iGPU - FP32 Performance (Single-precision GFLOPS)
The theoretical computing performance of the internal graphics unit of the processor with simple accuracy (32 bit) in GFLOPS. GFLOPS indicates how many billion floating point operations the iGPU can perform per second.
|
|
AMD Ryzen 7 5800X
@ 0.00 GHz |
||
|
|
Intel Core i9-9900K
Intel UHD Graphics 630 @ 1.20 GHz |
||
Blender 2.81 (bmw27)
Blender is a free 3D graphics software for rendering (creating) 3D bodies, which can also be textured and animated in the software. The Blender benchmark creates predefined scenes and measures the time (s) required for the entire scene. The shorter the time required, the better. We selected bmw27 as the benchmark scene.
|
|
AMD Ryzen 7 5800X
8C 16T @ 4.40 GHz |
||
|
|
Intel Core i9-9900K
8C 16T @ 4.70 GHz |
||
CPU performance per watt (efficiency)
Efficiency of the processor under full load in the Cinebench R23 (multi-core) benchmark. The benchmark result is divided by the average energy required (CPU package power in watts). The higher the value, the more efficient the CPU is under full load.
|
|
AMD Ryzen 7 5800X
15,228 CB R23 MC @ 119 W |
||
|
|
Intel Core i9-9900K
3.60 GHz |
||
Devices using this processor |
|
| AMD Ryzen 7 5800X | Intel Core i9-9900K |
| Unknown | Memory PC Intel i9-9900K Multimedia Office PC Intel Core i9 9900K Corsair ONE i160 Kompakter Gaming-PC Intel Core i9-9900K |
News and articles for the AMD Ryzen 7 5800X and the Intel Core i9-9900K
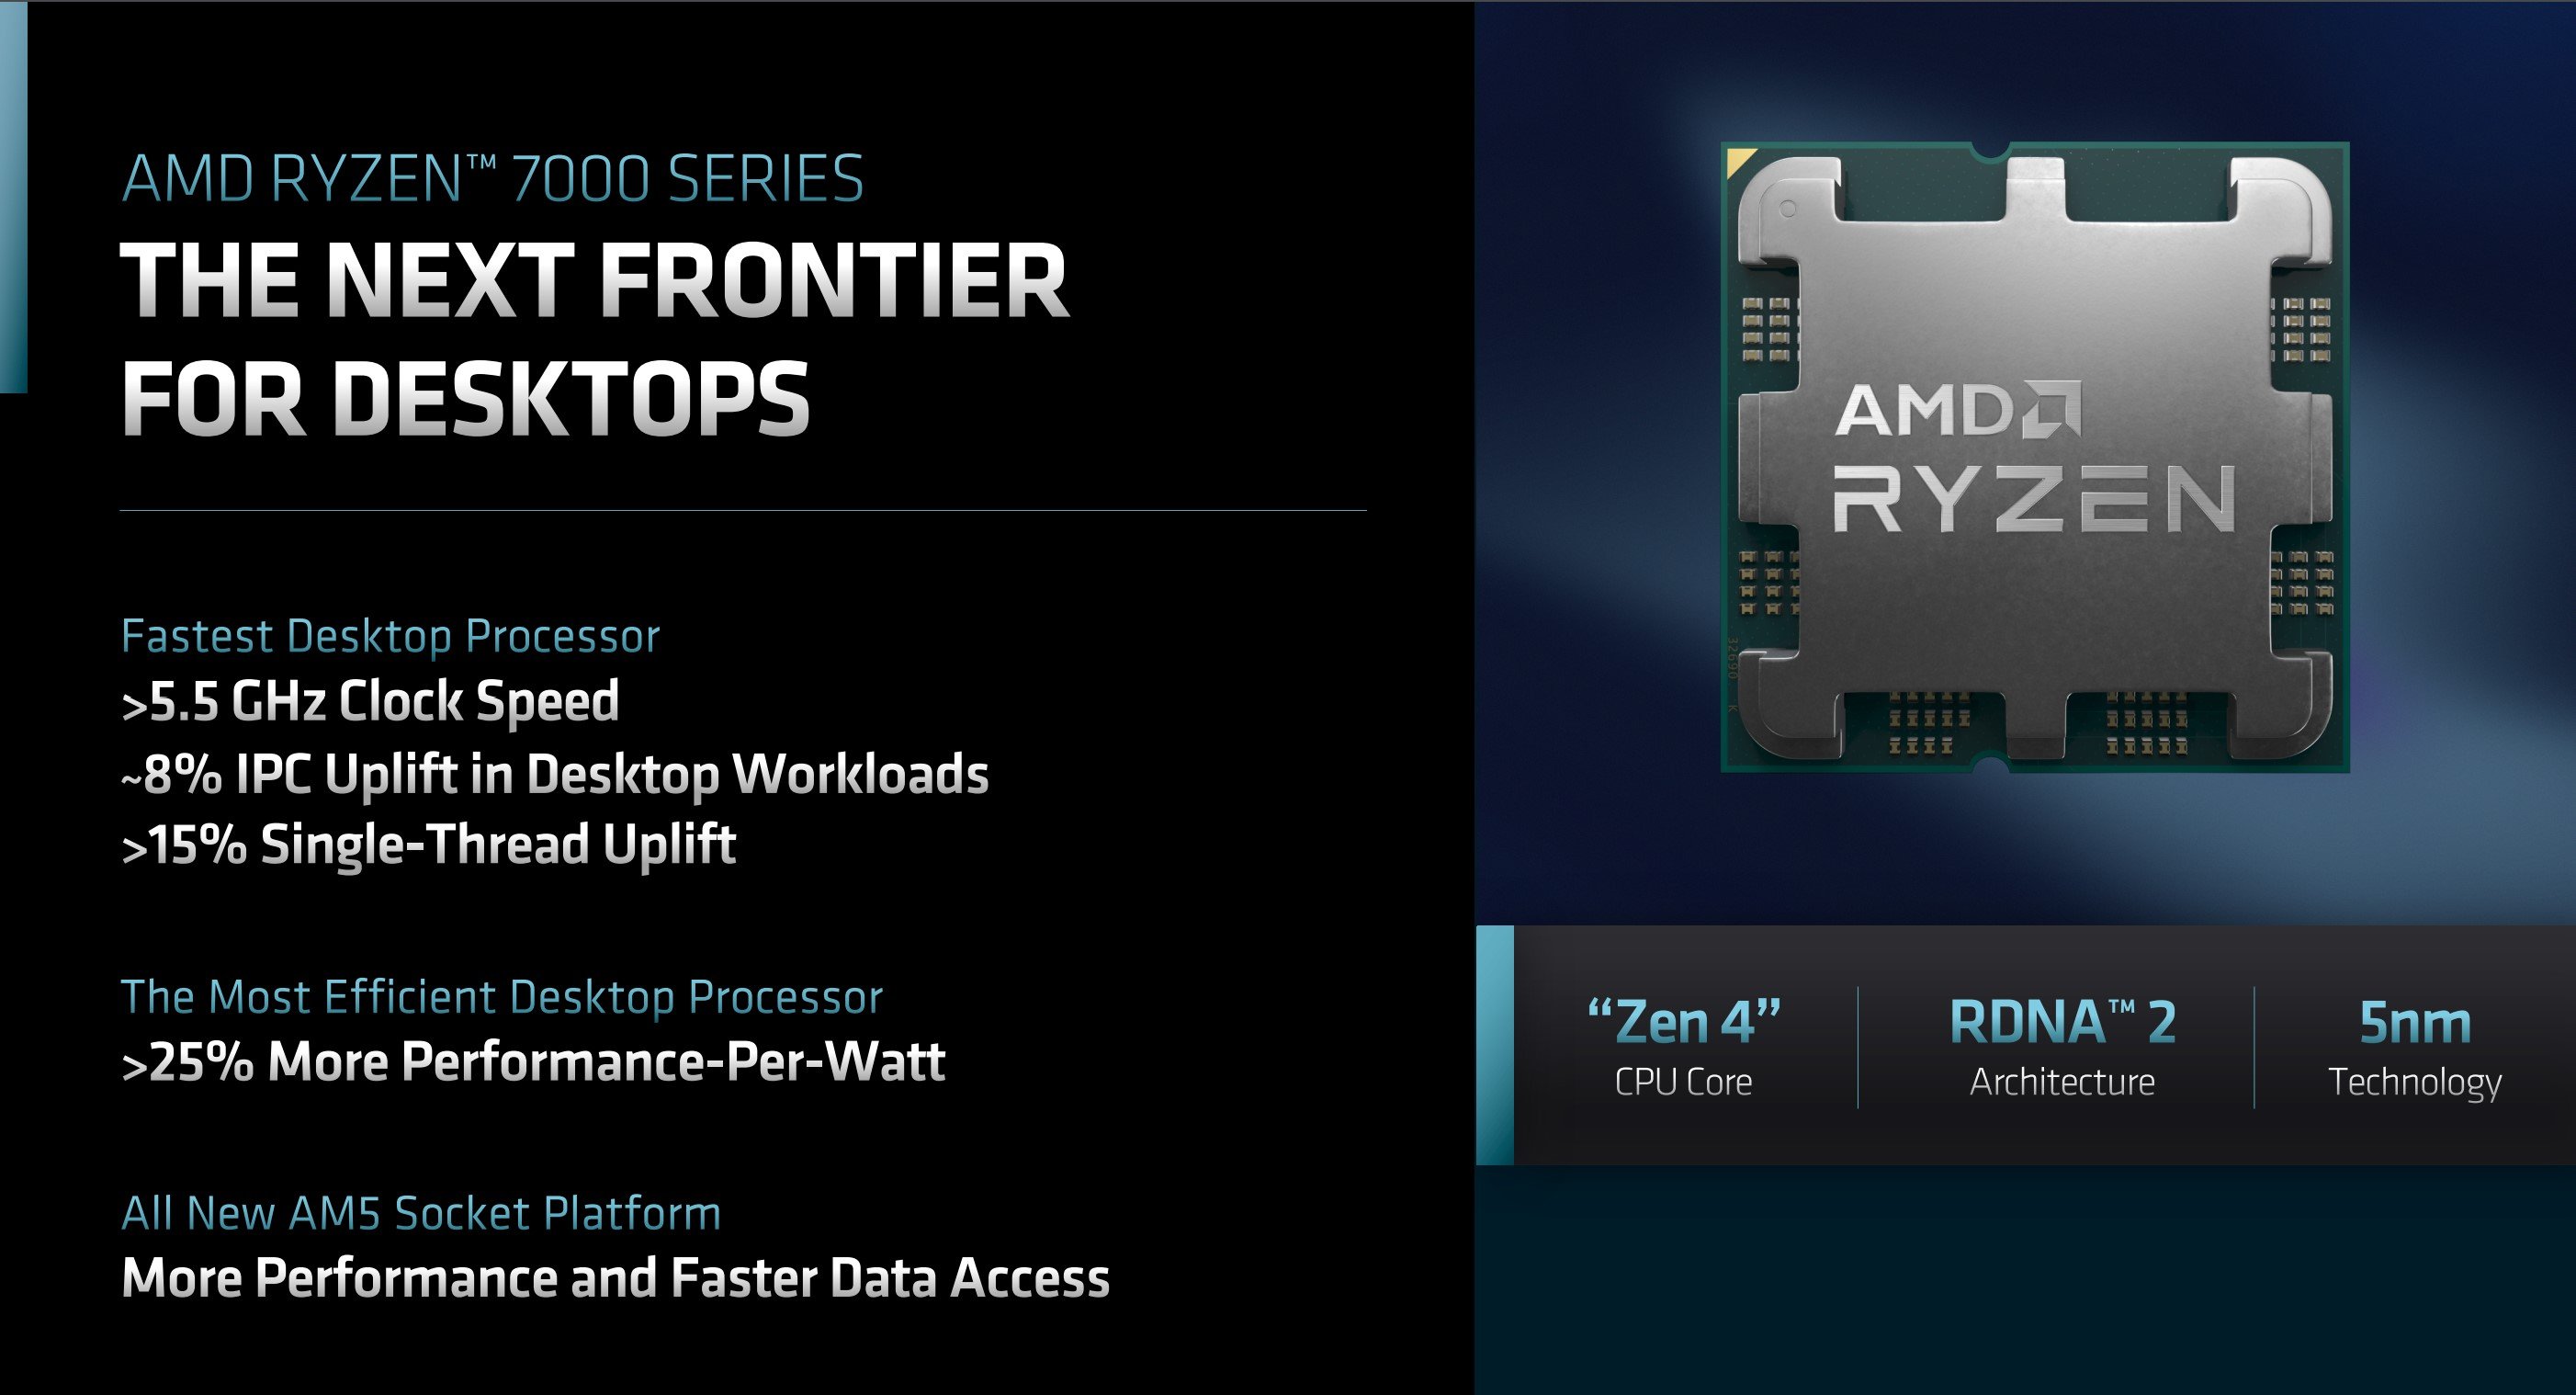
Why the new AMD Ryzen 7000 processors for the AM5 socket are currently not a good deal
Posted by Stefan on 2022-10-11
At the end of September 2022, the time had come: AMD presented its latest desktop processors called AMD Ryzen 7000. Initially, 4 processors with 6 to 16 CPU cores were released.
The new socket AM5 (LGA 1718) is used for the first time, which is intended to replace the very durable socket AM4 introduced in 2017 as AMDs mainstream platform. This includes (depending on the chipset) PCIe 5.0 support as well as the exclusive use of DDR5 memory on all AM5 mainboards.
Officially, DDR5-5200 is the maximum, but with AMDs EXPO Technology which is similar to Intel's XMP 3.0, AMD now also has a solution for easy overclocking of the main memory. AMD itself names DDR5-6000 as the sweet spot for the new AMD Ryzen 7000 processors.
The evolution of AMD Ryzen processors
Posted by Stefan on 2022-09-06
The AMD Ryzen processors are designed for the mid to high-end range and are grouped into the Ryzen 3, Ryzen 5, Ryzen 7 and Ryzen 9 classes. AMD follows the market leader Intel, which groups its Core i series (Intel Core i3, Core i5, Core i7 and Core i9) identically.
The AMD Ryzen processors were first introduced by AMD in Q1 2017. They are the successor to the not particularly successful AMD Bulldozer processors. The latter were manufactured using an outdated manufacturing process and could not keep up with the competing products from Intel. AMD lost a large portion of its desktop processor market share during this period.
The AMD Ryzen processors were first introduced by AMD in Q1 2017. They are the successor to the not particularly successful AMD Bulldozer processors. The latter were manufactured using an outdated manufacturing process and could not keep up with the competing products from Intel. AMD lost a large portion of its desktop processor market share during this period.
Most popular processors in the first half of 2022
Posted by Stefan on 2022-07-05
In the past we had repeatedly written about our most popular processors. Since this format was quiet popular, I would like to continue this today and introduce you the most popular processors in the first half of 2022.
With more than 2 million page views per month, CPU-Monkey is one of the biggest comparison sites for processors and is currently available in 16 languages.
With more than 2 million page views per month, CPU-Monkey is one of the biggest comparison sites for processors and is currently available in 16 languages.
AMD Ryzen 5 7600X and AMD Ryzen 7 7800X are coming in September
Posted by Stefan on 2022-06-20
After we published a performance assessment of the AMD Ryzen 9 7950X last week, the well-known AMD leaker Greymon55 has now posted more informations via Twitter.
He predicts the first four models of the new Zen 4 desktop generation, which AMD would like to present at the end of 2022. There is also an alleged release date of September 15, 2022.
He predicts the first four models of the new Zen 4 desktop generation, which AMD would like to present at the end of 2022. There is also an alleged release date of September 15, 2022.

AMD Ryzen 9 7950X - Cinebench R23 Benchmark projection
Posted by Stefan on 2022-06-10
We give you a preview of AMD's new Zen 4 desktop processors and calculate the performance of the AMD Ryzen 9 7950X top model for the new AM5 socket. The performance data and other technical details come directly from the press kit that AMD released as part of its Financial Analyst Day on June 9, 2022.
Up to 15 percent more single-core performance and 35 percent more multi-core performance of the 16-core model are realistic !
Up to 15 percent more single-core performance and 35 percent more multi-core performance of the 16-core model are realistic !
Comparison of the two processors
The two 8-core processors AMD Ryzen 7 5800X and Intel Core i9-9900K in direct comparison. Both desktop processors support Simultaneous Multi-Threading or Hyper-Threading and can process up to 16 threads at the same time.The base clock of the AMD Ryzen 7 5800X is 3.8 GHz, the processor can reach up to 4.7 GHz in single-core load applications via turbo mode, and the processor can still reach 4.4 when all CPU cores are loaded Clocking GHz.
The Intel Core i9-9900K has a clock frequency of 3.6 GHz and can also adjust this dynamically via a turbo mode. With single core load up to 5 GHz and with full load still 4.7 GHz are possible. However, since the processor is still produced in 14 nm, Intel buys these high clock frequencies with massive energy consumption that is significantly higher than that of the AMD Ryzen 7 5800X.
The latter is already manufactured in 7 nm by TSMC and is significantly more economical. The TDP of the processors is 105 watts (AMD) to 95 watts (Intel). In practice, however, the TDP hardly plays a role and in the end the picture turns in favor of the AMD processor.
Due to the better raw IPC performance of the AMD Ryzen 7 5800X, it scores around 20 percent better than the Intel Core i9-9900K in both single-core and multi-core benchmarks. And that although the Intel processor is allowed to clock 300 MHz higher with 5 GHz.
The Intel Core i9-9900K has an iGPU (internal graphics) in the form of the Intel UHD Graphics 630. Although this is not very powerful, the processor can also be operated without a dedicated graphics card.
In terms of RAM, both processors are almost the same: the AMD Ryzen 7 5800X already supports DDR4-3200, while Intel gives the Intel Core i9-9900K a maximum of DDR4-2666 support along the way. In practice, however, the RAM can also be overclocked on the Intel Core i9-9900k and thus run much faster than officially stated.
Popular comparisons containing this CPUs


back to index

